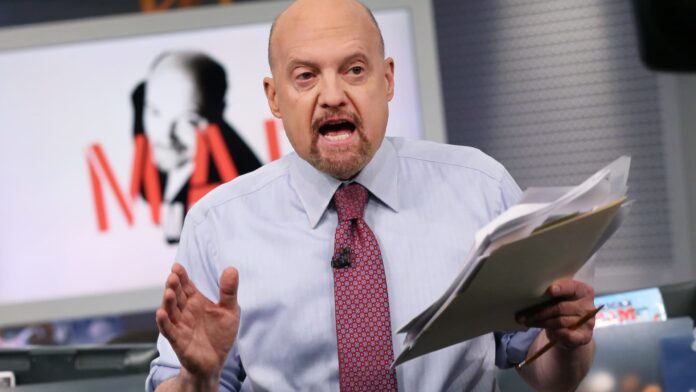
CNBC’s Jim Cramer told investors that Tuesday’s market recovery could be the start of a longer rally.
“The charts, as interpreted by the legendary Larry Williams, suggest that Wall Street has finally thrown in the towel and some powerful seasonal patterns are finally on the side of the bulls. I wouldn’t be surprised if he’s right again, meaning perhaps the bottom really is in,” the “Mad Money” host said.
All the major averages closed up for the day on Tuesday as investors bet the market has reached a bottom after its steep losses this year driven by persistent inflation, the Federal Reserve’s interest rate increases, the Russia-Ukraine war and Covid lockdowns in China.
“We got back on track today with that monster … rally. And, as Williams sees it, it might just be at the beginning,” he said.
To explain Williams’ analysis, Cramer first examined the weekly chart of the S&P futures going back to 2018.
On the chart is the market technician’s proprietary Williams Panic Indicator, which shows when investors sell off their holdings in droves, according to Cramer.
“When you get this kind of mass selling, the Williams Panic Indicator will throw off a buy signal, and historically that’s been a very good time to” do some buying, he said.
He added that the indicator flashed a buy signal on June 17, which has happened only 18 times in the last 90 years. “Almost every time, you had to pounce,” he said.
“So we’ve got capitulation. But capitulation alone isn’t enough — you also need something that can turn things around, and right now Williams thinks we’ve got time on our side,” Cramer said.
For more analysis, watch Cramer’s full explanation below.


